RACI Chart Example and How To Use It in the Workplace
Learn why project managers often use the RACI framework to ensure they aren't overusing their resources.
Just as you wouldn’t leave your sink running when you’re not washing dishes, not all of your work resources have to be used all the time. That extends to people, too – involving every team member in every task can quickly cause more clutter than cohesion. That’s why lots of project managers use RACI charts to preserve their team’s acuity, bandwidth, and other intangible resources. Find a RACI chart example and detailed explanation below.
- What is a RACI chart?
- What does RACI stand for?
- RACI chart example
- Benefits of RACI charts
- Disadvantages of RACI charts
- How to create a RACI chart
What is a RACI chart?
A RACI chart is a table that indicates your team’s roles and responsibilities for tasks and deliverables. It tells you who will perform a task, who assigns and finalizes the task, who has modest to passing involvement in it, and who should be aware of its progress. Its rows are tasks, its columns are team members, and its boxes show how these tasks and team members intersect.
What does RACI stand for?
With RACI, it’s all in the name. RACI stands for Responsible, Accountable, Consulted, and Informed – and each of these descriptors fully summarizes a team member’s role within a task. It works like this:
- The responsible team member is the one who’s actually doing the task. If you run a team of content writers and assign a blog to your senior staff writer, she’s the responsible person.
- The accountable person is the one who oversees final quality control – they’re accountable for how the work turns out. In this example, that’s you, since you assign work to the appropriate team member and finalize all drafts.
- The consulted team member provides non-supervisory feedback to the responsible person. They can include other team members familiar with the subject matter of the blog or those whose work is affected by the responsible person’s output.
- The informed team member is, well, anyone else involved with the task. Even someone who must be kept superficially aware of the project’s progress is an informed team member. Examples could include your marketing manager – they won’t be creating your content, but they’ll be promoting it after your team completes the task.
Depending on the task, each of the above descriptors might fit just one person, or several people might be responsible, accountable, consulted, or informed. The below RACI chart example will get into this all.

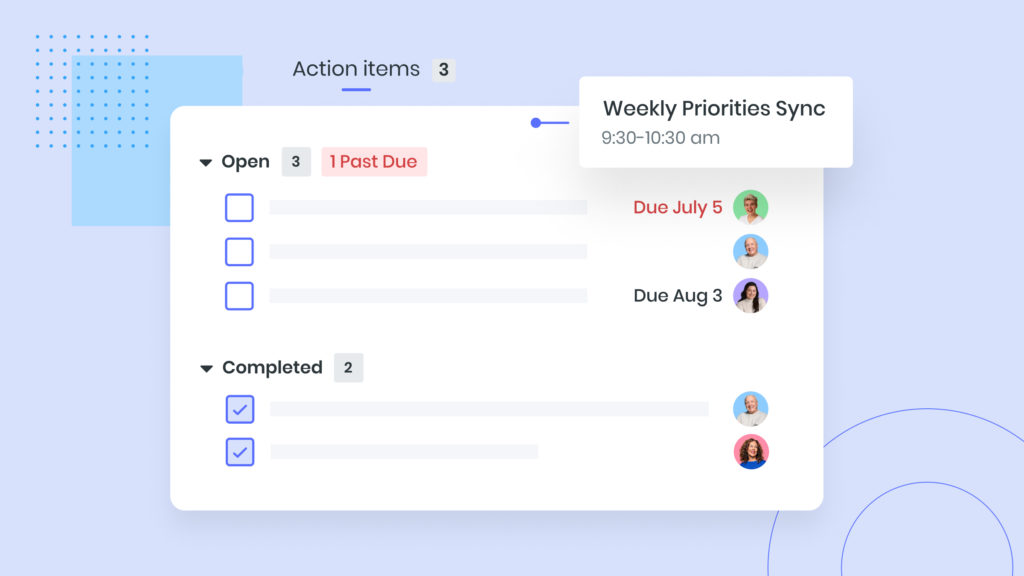
Stay on top of it all
Assign and record action items to stay on top of deliverables using a tool like Fellow!
RACI chart example
Creating a RACI chart is easy – and so too is understanding your chart. The below RACI chart example clearly delineates the involvements of eight team members across eight tasks in a project – it leaves no questions unanswered. If you needed something from this team, you’d know exactly who to ask.
Here’s the RACI chart example, courtesy of GatherContent:

It’s clear from this RACI chart example that the writer is responsible for (unsurprisingly) writing the content and ensuring that their final product meets the guide or requirement set out by the client. They’re also involved in the editing, approval, and fact-checking process.
The approval process is where this RACI chart gets interesting – both the customer success and product marketing leads handle content approval. However, only the customer success lead is involved with fact-checking. If you’re a project manager reckoning with this chart and you notice this dual role, you might thus be inclined to shift more of the content approval workload to the product marketing lead.
Looking at the “write content” task, you’ll also see consulting roles for the content designer, customer success lead, and project success lead. You’ll also see that the head of CS and head of content have, respectively, informed and accountable roles.
You might also notice that these department heads have only informed and accountable roles across all eight tasks. When you observe this, you might also see that all other team members are only responsible or consulted. This role division between department heads and other team members is pretty common. It’s basically the standard chain of command depicted graphically – think of it as putting obvious colors, letters, and boxes to an abstract but important order.
Benefits of RACI charts
Our RACI chart example makes that team’s roles incredibly easy to understand. This understanding comes with the following benefits:
1 More efficient communication.
Have a question about a project in progress? You’ll know exactly who’s working directly on it and who’s overseeing that work. These are exactly the people to whom you should direct your question. If your question emerges after the product is finalized, direct it to the accountable person.
2 Manageable feedback.
A Google doc with many comments from multiple people can quickly get out of hand. RACI charts avoid this issue. Only those directly involved with the creation and approval process – that means responsible, consulting, and accountable members – get a say. Combining a RACI chart with a suitable approval workflow tool can make the approval process straightforward and more manageable.
3 Easier division of labor (and knowledge).
Seeing too many R’s and C’s in a team member’s column? Move some of their work to another team member. In our example above, the customer success lead has quite a few responsibilities. Surely, one of the department heads or the product manager (who has literally one involvement across all tasks) can take some of that work.
RACI charts also show that no one task belongs to any one person. If one person doesn’t have the knowledge or resources they need for the task, they can turn to any responsible, accountable, or consulting team member. This structure shares the task’s burden across your whole team.
4 Obvious roles.
With a RACI chart at hand, everyone on your team will know exactly which tasks they’re involved in and in what capacity. The result is a team that sticks to your project plan and task list even when times get rough (and even the best-prepared teams always have rough patches).
Disadvantages of RACI charts
RACI charts’ simplicity is at once their calling card and their crutch. Some team leaders feel that RACI charts are inadequate project management tools for the following reasons.
1 Unclear distinctions between roles.
When you say that someone must be informed of a project, what does that really mean? Does that mean they need daily updates, and from whom should these updates come? RACI charts can’t answer these questions.
Similarly, designating three people as consultants says nothing about how they’re expected to consult on the project. Will they provide comprehensive outlines, or advise on just one portion of the task? RACI charts fail to answer these questions more than superficially.
2 Deviation from roles.
A RACI chart is only binding in theory. It’s far from unheard of for team members to dip their toes into tasks for which their RACI chart column shows no involvement. This could be an editor getting involved with design or the head of content whose micromanager style leads to them doing all the writing anyway.
3 Artificial complexity.
RACI charts are excellent for delegating complex tasks to team members. They’re not as great for simple projects – sometimes, all the blocks and letters can add needless complexity to a straightforward set of tasks.
If three team members are working on four tasks, siloing each team member into discrete roles might not be necessary. Such a small team is likely to be in regular communication, plus each team member’s role might be somewhat fluid given the team’s size. Here, the firm boundaries in RACI charts fall apart.
4 Lengthy creation process.
Some project managers might feel that creating a RACI chart just takes too long. These project managers might think that there’s no reason to spend all this time visualizing and formalizing roles that should be obvious given a team’s structure or a person’s job description.
Here’s the thing, though: Rare is the project management tool that doesn’t involve some amount of tediousness to make. Project management software can help on this front.
How to create a RACI chart
Ready to make a RACI chart? The process doesn’t have to be time-consuming or complicated, especially if you use project management software instead of pen and paper. You can do it in just four quick steps:
1 Add your roles or team member names to the top row.
Writer, editor, and content designer or Ana, Jeff, and Cynthia – either of these sets of roles or names should be at the top of your RACI chart. Each role or name gets its own column.
2 Add your tasks to the leftmost column.
As you see in our RACI chart example, the project we’re working on involves eight tasks. You know this because there are eight rows, each of which has its own task description. This structure is the basis of all RACI charts.
Since we’re talking about rows and columns here, this will all look a lot neater in a spreadsheet than on pen and paper. You can also use project management software dedicated to RACI charts – that might save you a slight bit of time on the next step.
3 Write the appropriate letter (if any) for each box.
Where the row for providing product imagery intersects the product designer’s column, you’ll put an R because this task is the product designer’s main responsibility. You’ll then add consulting, accountable, and informed boxes as appropriate. With some RACI chart software, you can click on a box and just indicate R, A, C, or I instead of actually typing the letter.
Importantly, every task gets at least one R, A, C, and I – but not every team member gets all four. The product designer, for example, has just one R and no A, C, or I. (Perhaps this person is a freelancer or is just really busy with design work – most team members have R’s and C’s.)
4 Share your RACI chart.
Your whole project team should have your RACI chart available at all times, so don’t hesitate to share it! Again, doing so is a lot easier with a digital document than a paper chart.
It’s not a RACI to the finish line
RACI charts can clearly delineate team members’ involvements with tasks so all your work is evenly divided and moving along as intended. They’re great planning tools, and the best part is that adding more tasks to them takes just moments. Just add a new row, place your letters appropriately, and voila – a plan of attack!
If your team meetings are one of your most frequent sources of new tasks, make sure to add these action items to your RACI chart sooner than later. Fellow can expedite recording and assigning these action items – don’t forget to add them to your RACI chart!
-
 Meetings
RACI Meeting: Your Complete Guide to a Well-Informed Team
7 minute read -
 Productivity
PERT Chart Vs. Gantt Chart: Which One Should You Use?
10 minute read -
 Productivity
How to Create a Work Breakdown Structure in 6 Easy Steps
7 minute read -
 Productivity
How to Create a Google Sheet To-Do List
7 minute read -
 Management
What Is Resource Leveling in Project Management? (+ Examples)
8 minute read -
 Leadership
What Is an Org Chart? Types, Benefits, and How It Works
7 minute read -
 Meetings
Scrum vs. Kanban Strategies: Differences and Comparison
8 minute read -
 Productivity
How to Organize a Project: Our 12 Most Effective Steps
9 minute read -
 Leadership
The Role of Subject Matter Experts in Project Management
7 minute read
-
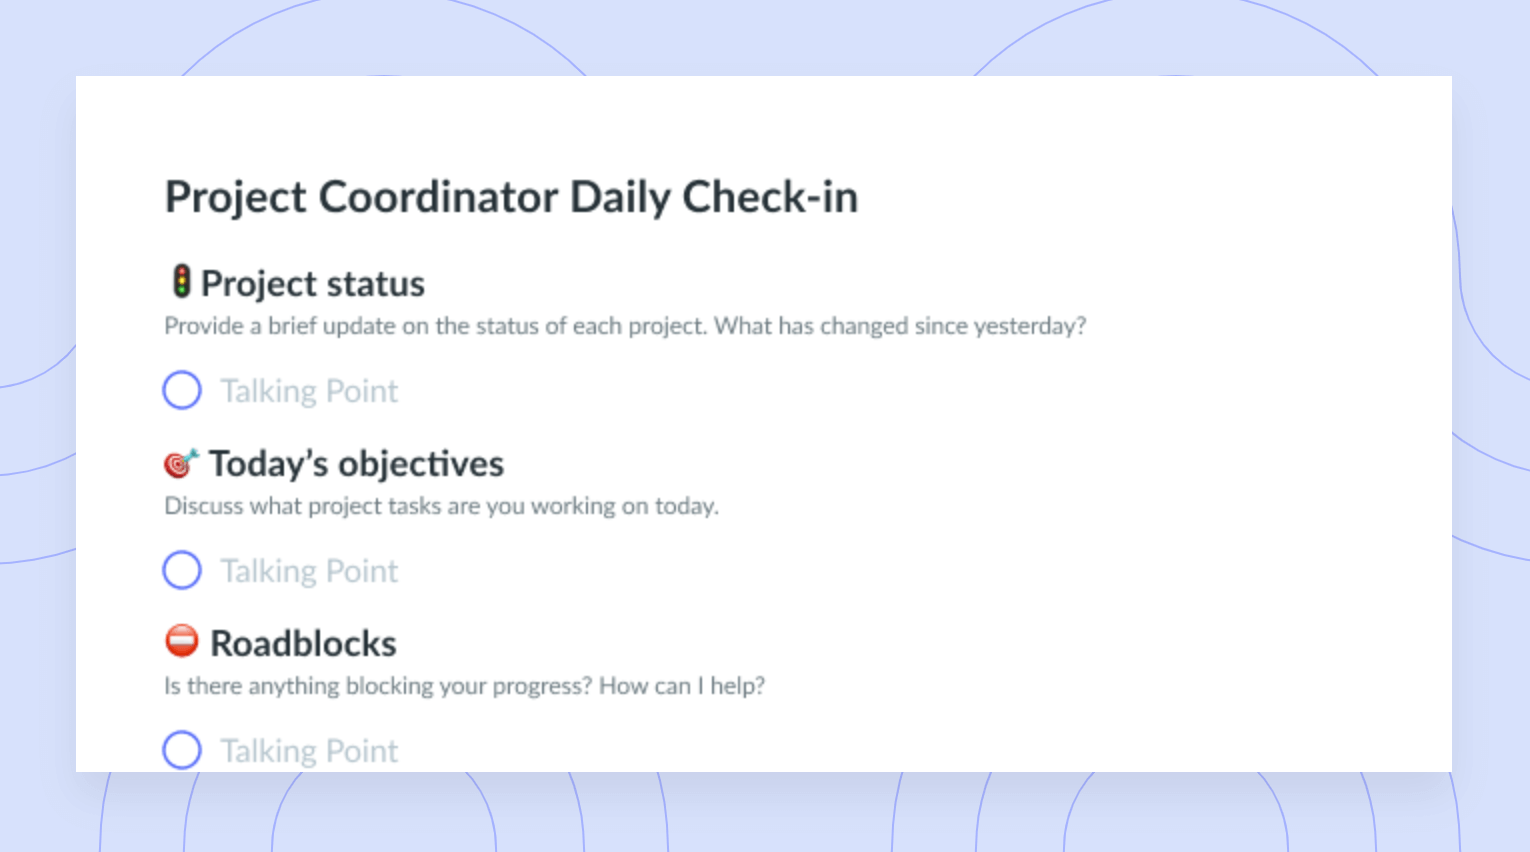
Project Coordinator Daily Check-In Meeting Template
-

First Research Team Meeting Template
-
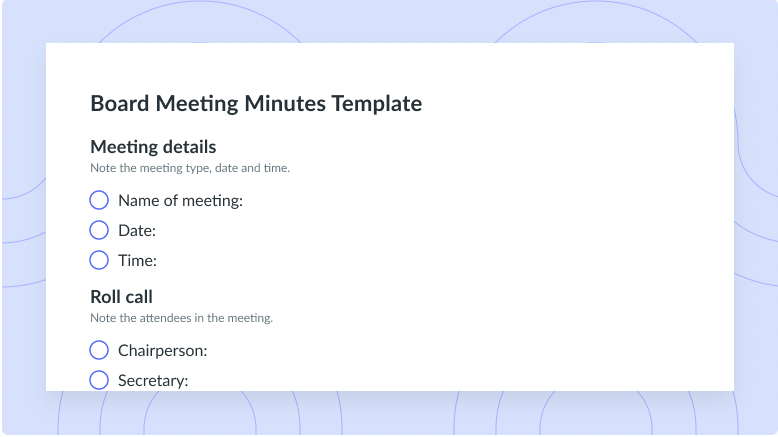
Board Meeting Minutes Template
-
EOS Compatible Meeting Agenda
-
Weekly Design Review Session Agenda
-

SaaS Sales Meeting Template
-

Series A Board Meeting Template
-
Kanban 1-on-1 Weekly Check-in
-

Design Asset Review Meeting Template