What is Business Intelligence?
Take a smart approach to collecting and using your organization’s data with a business intelligence strategy.
Your business deals with tons of data on a daily, monthly, and yearly basis. All this data tells a sort of story about your organization and its processes. A business intelligence strategy helps you find the data you need for a complete read on your organization and a clear path forward. So, then, what is business intelligence? Learn all about it below – and how you can implement a business intelligence strategy for your organization.
- What is business intelligence?
- Benefits of business intelligence
- What are the four concepts of business intelligence?
- What are the BI methods?
- Why organizations need BI platforms
- BI platforms in action
- How to develop a business intelligence strategy
What is business intelligence?
The term “business intelligence” (BI) refers to several strategies, practices, and tools that organizations use to analyze information and make decisions based on data. Data mining and visualization are both part of business intelligence, which is part of business analytics.
Benefits of business intelligence
There are several ways business intelligence can benefit your business. Here are just some of them.
- Data clarity. You’re already smart, but business intelligence makes you smarter. Organizing and analyzing your data can help you get a clear picture of what’s happening within your organization from top to bottom.
- Increased efficiency. With business intelligence, you get strategic processes to make pulling, storing, analyzing, and organizing data much easier and faster. This way, your team members can work more efficiently, and your organization can operate at peak performance.
- Improved employee satisfaction. The dashboards included in BI tools give your team the information they need to streamline some of their most tedious tasks. This leaves them with extra brain power, motivation, and productivity to put toward more fulfilling tasks. This lack of tedious work can lead to happier employees.
- Better customer experience. You can use BI to look directly at data that represents customers’ interactions with your business. From there, you can create informed solutions for improving your clients’ experience.

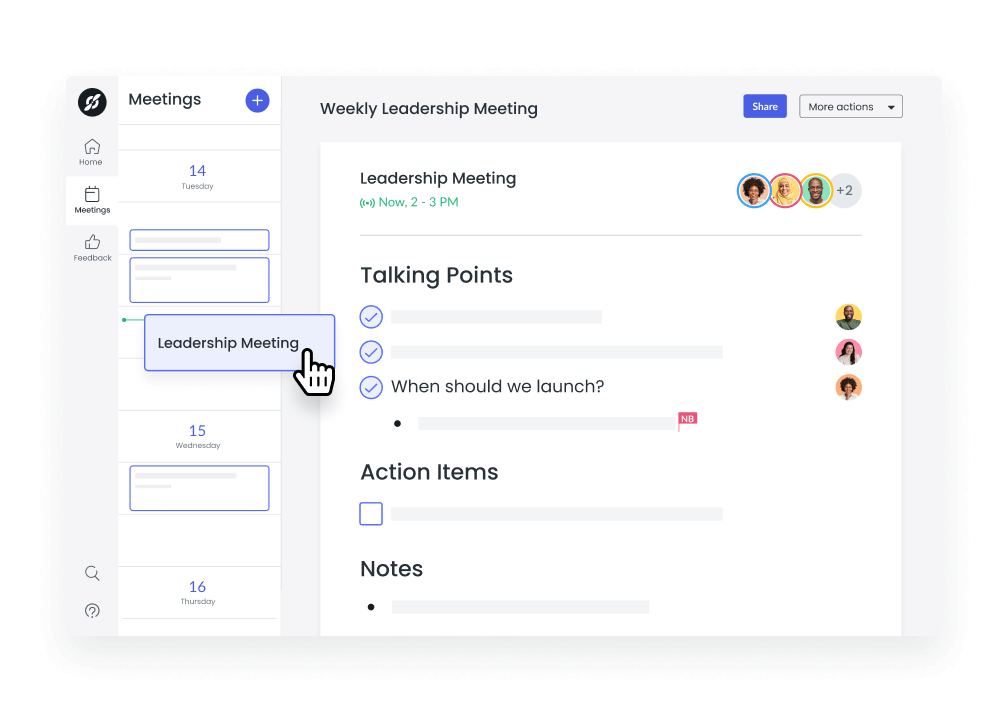
Managing a team?
Take control of your team meetings by having collaborative meeting notes and encouraging accountability with action items. Try a tool like Fellow!
What are the four concepts of business intelligence?
Business intelligence involves the four main concepts below.
1Data extraction
This concept is all about getting raw data from sources within your organization. This data can be anything from sales records to financial statements or responses from a marketing survey,
2Data consolidation
Your organization’s data is likely stored in many different databases. Business intelligence involves putting it all into one place (a “data warehouse”) and creating relationships between your different databases. This is called data consolidation.
3Data analysis
With the data you’ve collected, you can conduct a thorough analysis. Here, you’re looking for patterns and trends that can help you better understand your data.
4Data reporting
When you complete your analysis, you’ll still have just raw data on your hands. With data reporting, you’ll create visuals to present your data, patterns, and predictions in a more digestible format.
What are the BI methods?
There are several methods involved in getting and using your organization’s data. Below are some common business intelligence methods.
- Querying
- Data mining
- Statistical analysis
- Performance metrics and benchmarking
- Reporting
- Descriptive analytics
- Data visualization
- Data preparation
1Querying
Before you can analyze data and create reports from it, you need to access it. Querying is how you do that – it’s the process of requesting data from a database. You can use special query languages and set specific parameters to find the exact data you need.
2Data mining
Data mining is the process of gathering data from large databases to create new sets of information. For example, you might use data mining to gather data on email open rates over the past two years. This can help you find new ways to make your emails stand out to subscribers and increase your open rate.
3Statistical analysis
Statistical analysis involves getting into the tiniest details of a data sample to identify trends that exist within the whole data set. The goal here is to make informed decisions without looking through an entire massive data set.
4Performance metrics and benchmarking
Looking at metrics can give you a good idea of your team’s and organization’s performance. Lead time, cycle time, and story points are some metrics you can use to track everyone’s success. You can also pull information from your competitors to see how you’re stacking up to them and where you can improve.
5Reporting
Creating reports can help you meaningfully present the data you’ve gathered and analyzed. For example, you might create a financial report that shows your revenue from a previous project.
6Descriptive analytics
Descriptive analytics involves looking at data to get better insights into your now and your past. It’s like looking under the hood of your organization to see what’s been going on from a data perspective. Charts, graphs, and tables can come in handy here.
7Data visualization
Data visualization involves presenting your data in a concise, digestible format for a larger audience. For example, you might take responses from customer surveys and create a detailed presentation about how to best market to customers next quarter. Your team might then present a bunch of charts and graphs during a marketing strategy session.
8Data preparation
Exploring your data gets a lot easier (and more exciting) when you can see exactly what you’re working with. When you first pull data, you’ll need to organize it, toss out any parts you don’t need, and properly label what you want to use. This way, when you’re ready to analyze your data, you have clear figures and facts at your fingertips.
Why organizations need BI platforms
BI software takes a lot of the guesswork out of business intelligence. A BI platform is a big data solution that helps business users turn tons of facts and figures into useful insights. With this information, you can address risks before they pose problems and identify trends that can move your team and organization forward.
There are likely hundreds of sources that store your organization’s data. A BI platform can access each of these sources to pull exactly the data you need and give you a thorough view of your organization. It can then remove poor data from that set and blend the data you want to use, all while helping you organize it.
One of the best features of BI platforms is their ability to promote team collaboration. Team members can work within the platform together, share comments, and get notifications when something calls for their attention. To top it off, many BI platforms integrate with other engineering tools to create seamless flows within your organization’s current processes.
BI platforms in action
Below are some ways business intelligence platforms can serve your organization.
- Visualize supply changes over time
- Visualize supply changes over time
- Analyze the results of marketing campaigns
- Automate reporting
- Integrate with cloud-based, third-party platforms
- Embed dashboards into custom solutions
1Visualize supply changes over time
BI platforms can help you see all parts of your organization’s supply network in real time. You can see when inventory ran low, whether there was excess supply, and any bottlenecks that caused issues over time. BI platforms also help you identify the root cause of these bottlenecks so you can prevent future disruptions.
2Review and forecast sales and profits
Sales trends are key to helping your organization meet client demand. To address this demand, you need to collect data on your past sales. A BI platform can help you gather the data you need to accurately view sales trends.
Many BI platforms are supported by online analytical processing (OLAP), which aids in discovering data, forecasting, and reporting. With these insights, you can then future sales and profits and make all kinds of business decisions.
3Analyze the results of marketing campaigns
After closing out a marketing campaign, you now have tons of sales and new customer data to work with. Where do you start? With business intelligence platforms, of course – they can help you dive into the details of your data. This includes everything from website and predictive analytics to social media engagement statistics and customer feedback.
4Automate reporting
Business intelligence tools can automate many data reporting processes. You can complete tasks that once took several days in just hours or a few minutes. The platform can then send these reports to stakeholders, scratching off another task on your to-do list.
5Integrate with cloud-based, third-party platforms
Many BI platforms integrate with cloud-based and third-party platforms such as Amazon Web Services and Microsoft Azure. This way, you can access all the data sources you need for thorough analyses and reports.
6Embed dashboards into custom solutions
WIth many BI platforms, you can create custom dashboards that organize and display data from multiple sources. You can also create presentations that show the statistics and trends you need with animated and real-time visuals.
How to develop a business intelligence strategy
Below are the steps you can take to build an effective BI strategy for your organization.
- Know your goals
- Identify key stakeholders
- Choose a sponsor
- Set up a BI platform
- Create a BI team
- Define your goals and roadmap
- Prepare your data infrastructure
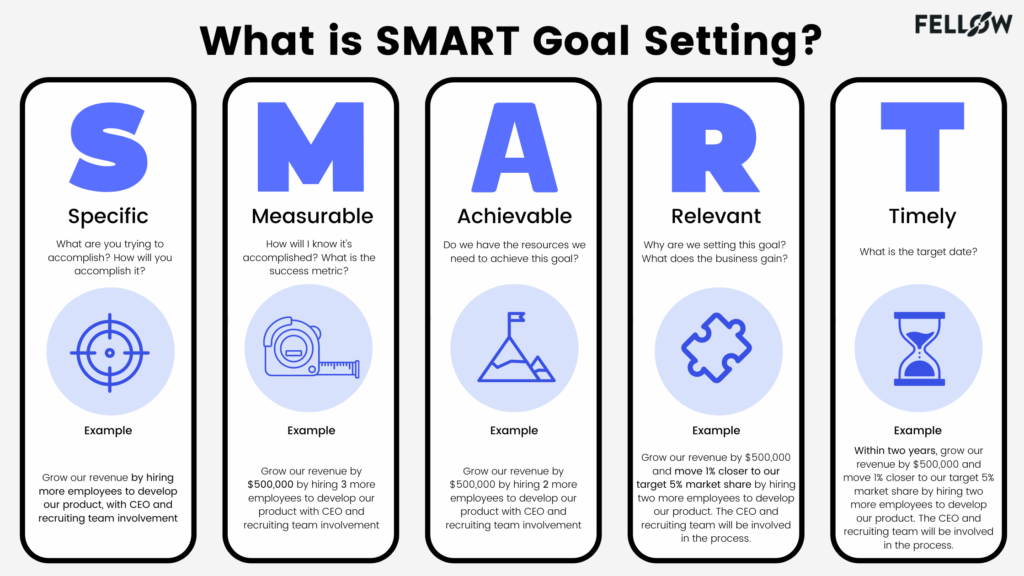
1Know your goals
Are you looking for consumer insights, financial trends, or supply predictions? Setting SMART goals can help you figure out the type of data you need, how to find it, and the type of analyses you’ll need. You should also set key performance indicators (KPIs) you want to reach so you can ensure your team is headed in the right direction.
2Identify key stakeholders
Who will benefit the most from your business intelligence strategy? Ask yourself this question to identify your key stakeholders. From there, you can determine exactly what these stakeholders need and how your strategy can meet these needs.
3Choose a sponsor
Out of the stakeholders you’ve chosen, you’ll need to crown a specific member as a sponsor. Choose someone who clearly understands your organization’s vision and goals – this person can best oversee your strategy. Chief financial officers and chief marketing officers are often good picks for this role.
4Set up a BI platform
You’ll need to choose the BI platform that most aligns with your organization and its workflows. The best BI solutions will include custom dashboards, data visualization, and automated insights.
5Create a BI team
You’ll need team member involvement to carry your BI strategy forward. Assign team members roles and tasks they should follow to help your organization see results.
6Define your goals and roadmap
You should create a BI roadmap based on the goals you want to see from your strategy. This way, your stakeholders can see the exact path you and your team are taking to reach the goals you set. You can create visualizations that show your goals, your approach, and the data you’ll use along the way.
7Prepare your data infrastructure
Software, hardware, databases, and machine learning systems are all parts of your organization’s data infrastructure and the backbone of your BI strategy. As you launch your BI plan, you’ll want to make sure these components are updated and that your team knows how to use them.
The smart way to use data
Business intelligence can give you all the insights you need to make the most of your organization’s data. As you start your BI strategy, it’s important to make sure your team stays on the same page every step of the way. Fellow can streamline your approach to BI with tools that prioritize organization and collaboration.
It’s never been easier to find meeting notes, set OKRs, and assign meeting action items. Fellow is a centralized home for these elements, making it easy to keep clients and stakeholders informed about your projects. With Rellow, you can take the smart and simple approach to working with your organization’s data.
-
 Meetings
12 Chrome Extensions for Productive Meetings
7 minute read -
Feedback
20 Questions to Ask Employees For Feedback + Templates
8 minute read -
Meetings
Production Meetings: 6 Steps to Run a Effective Production Meeting (+ Tips)
7 minute read -
Management
Management by Objectives (MBO) Strategy: 5 Steps [+Example]
8 minute read -
Leadership
How to Meet One-On-One With a Chief of Staff
6 minute read -
Meetings
How to Write a Meeting Memo in 7 Steps
6 minute read -
Productivity
AI and Privacy: Key Concerns for Organizations and Users
-
Meetings
How to Run an Efficient Committee Meeting: 10 Key Steps
7 minute read -
Productivity
The 11 Best Note Taking Apps In 2024
10 minute read


![Management by Objectives (MBO) Strategy: 5 Steps [+Example]](https://fellow.app/wp-content/uploads/2023/06/Management-by-objectives-MBO2.jpg)


-
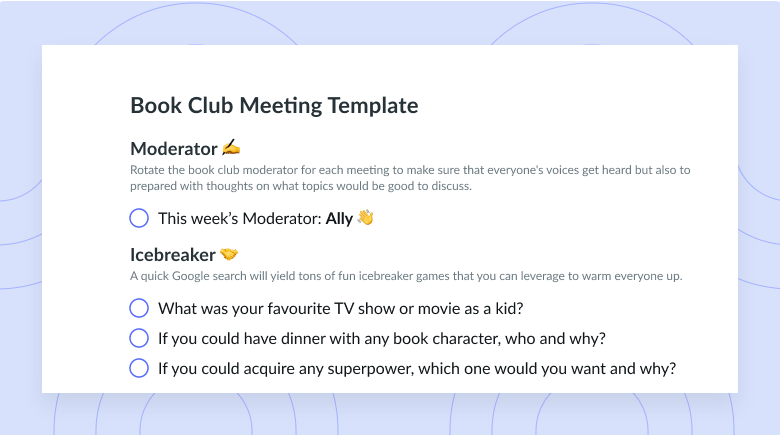
Book Club Meeting Template
-
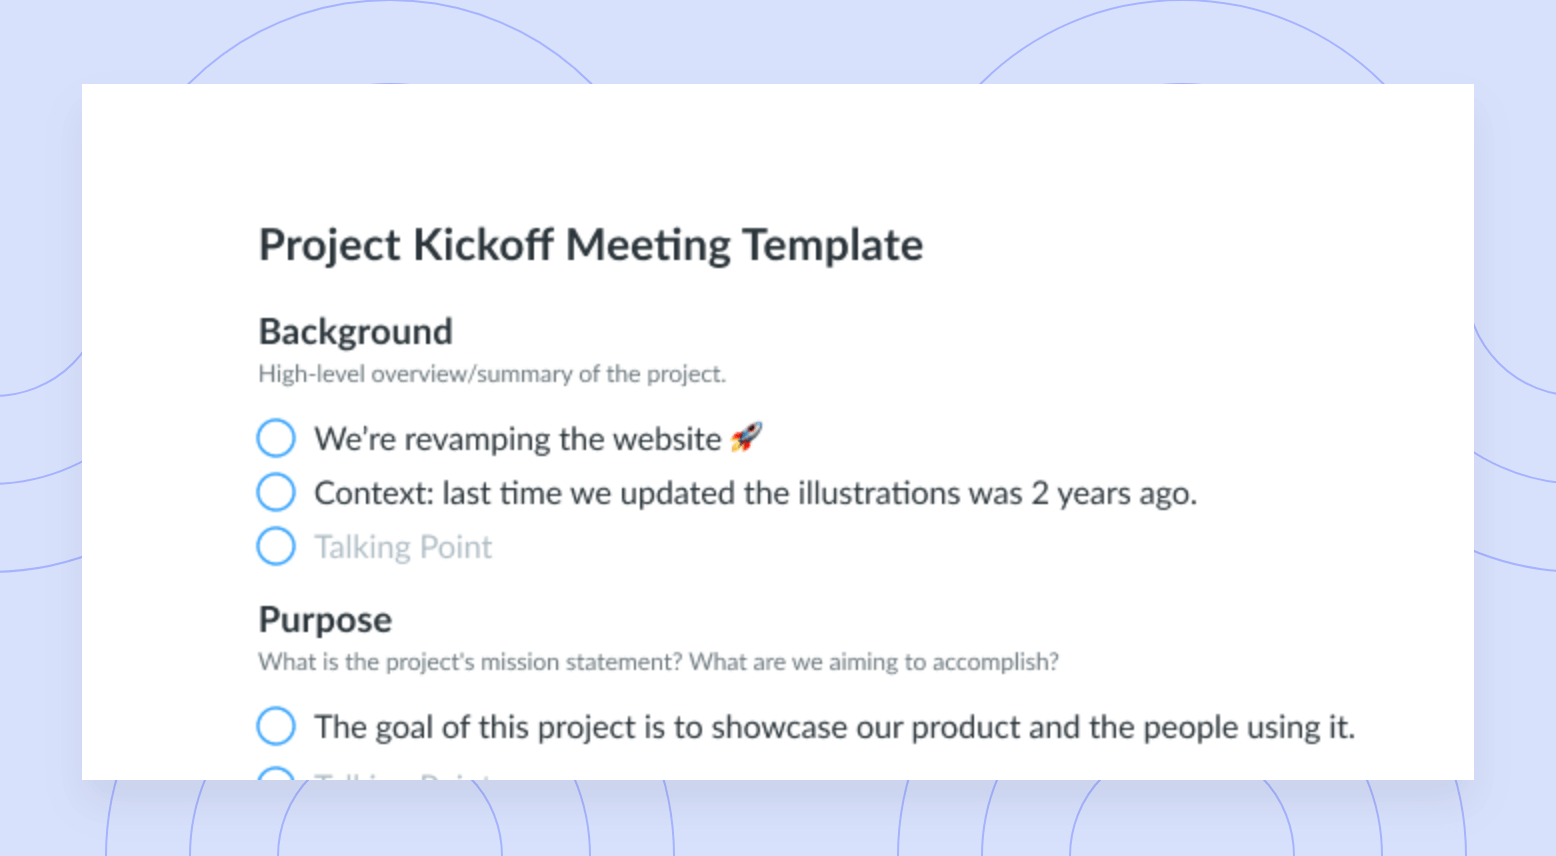
Project Kick-Off Meeting Agenda Template
-
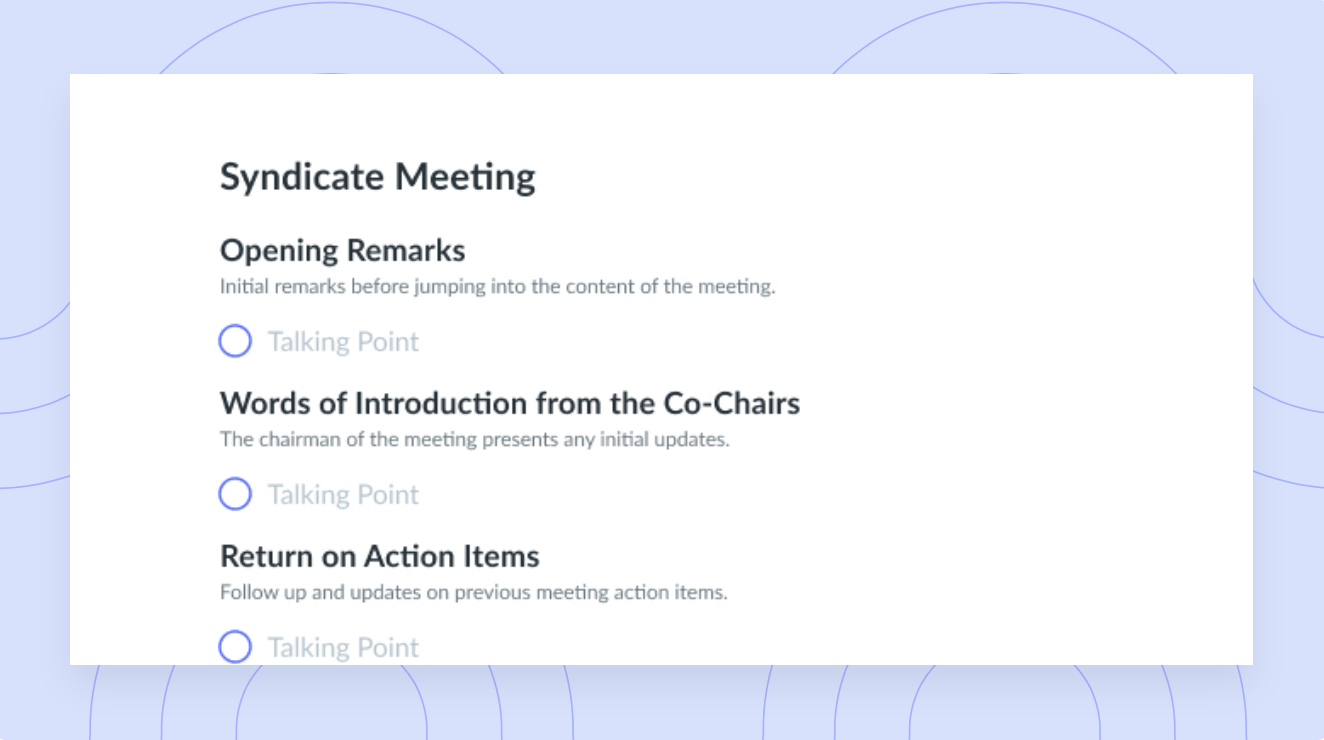
Syndicate Meeting Template
-
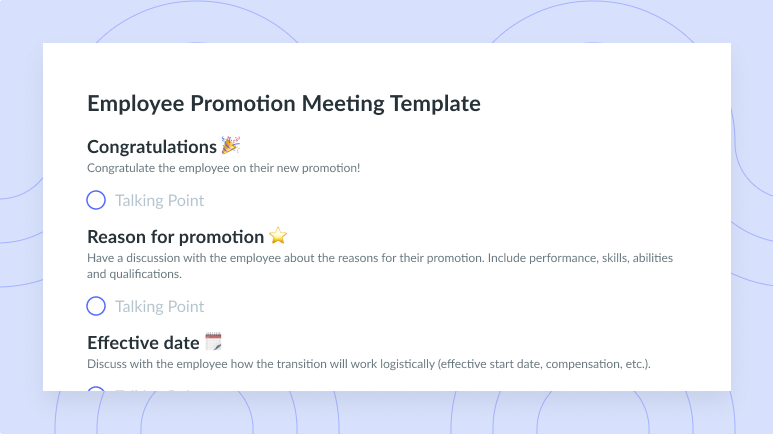
Employee Promotion Meeting Template
-
Sales Team Insights Meeting Template
-
Client Quarterly Business Review Meeting Template
-
Sales One-on-One Meeting Template
-
First 1-on-1 with Product Designer
-
Marketing Campaign Kick-Off Meeting Template