Engineering Metrics: What They Are + 10 Ways to Measure Them
Engineering teams should know the specific metrics to keep an eye on to show how the team is progressing—here are 10 best metrics to measure.
How do you measure success?
The short answer is… it depends. Across several organizations, success looks different to each department. While the sales team may focus on revenue earned, the marketing team may keep their eyes on traffic to the company website.
And what about the engineering team? Typically, a company’s engineering team focuses on specific metrics that determine if the team is being productive, if deadlines are being hit, and if team members are working together to accomplish particular goals.
If you’re unsure of which metrics your engineering team should focus on, we break them down below!
- What are engineering metrics?
- Why are engineering metrics important?
- 10 engineering metrics to measure
- How to track engineering metrics with Fellow
What are engineering metrics?
First things first: engineering metrics will provide a standard of measure for a software product. As an engineering team develops software, several things are happening at once. A team lead or manager will want to measure every activity to accurately estimate the effort and the size of the project taking place.

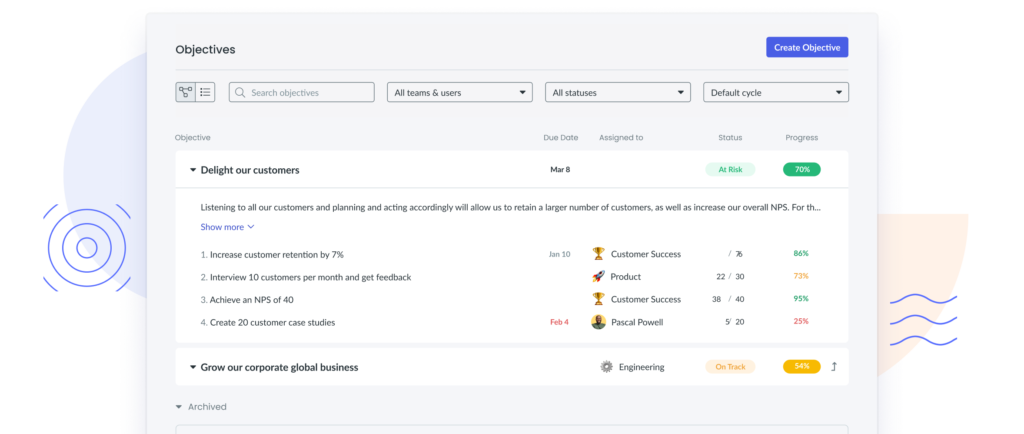
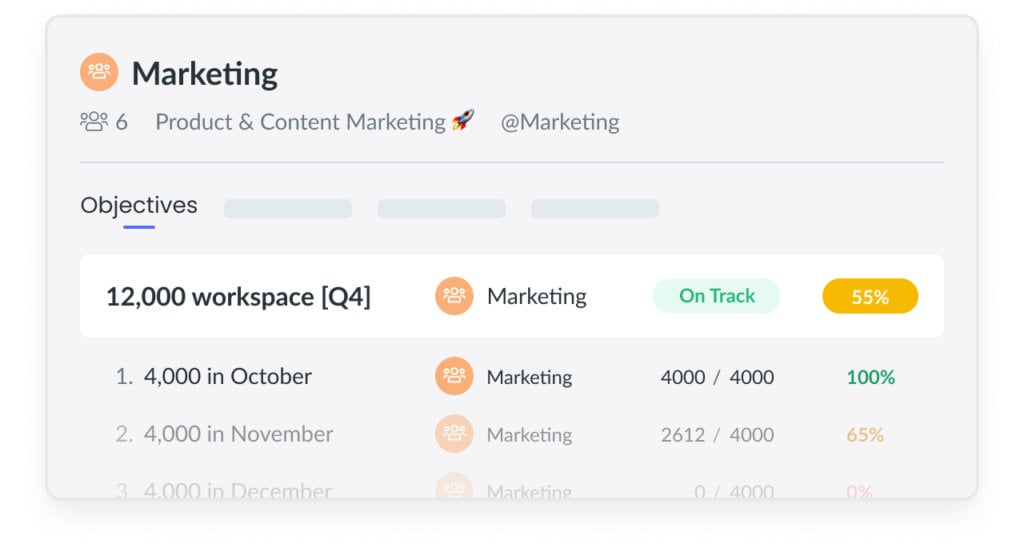
Track engineering metrics
stay on top of your team’s metrics by clearly recording, defining, and tracking the progress of these metrics in Fellow’s Objectives tool!
Why are engineering metrics important?
Engineering metrics can provide the insights a company is looking for regarding the present and future success they may experience.
It’s essential to track and measure these metrics because doing so can lead to predictions like:
- What the budget for the project should be
- How much effort is needed from the team to develop the project
- How long the project will take to complete
- What type of schedule the team should follow along the way
Additionally, other benefits a team may experience from tracking specific engineering metrics include an increase in the quality of the finished product and a boost in the team’s productivity.
10 engineering metrics to measure
There are several metrics your team can track, and which are the most important will likely depend on the team’s goals and those of the organization. However, some metrics tend to be more valuable than others.
If you aren’t sure what type of engineering metrics you should be tracking, start with these 10!
- Lead time
- Cycle time
- Number of story points
- Mean time to restore
- Days worked
- Context switching
- Deploy frequency
- Change failure rate
- Rework ratio
- WIP balance
1Lead time
The first metric an engineering team should measure is lead time. This indicates the time needed from feature description to implementation during the production environment. This metric can signify to managers how smooth their engineering process is, from start to finish, and if improvements need to be made.
When a team struggles with a lack of ownership or lacks a clear description, both can negatively affect the lead time. Additionally, lead time can help the team plan new features and pinpoint the capacity needed for the most realistic roadmap possible.
2Cycle time
Regardless of your engineering team size, cycle time is a crucial metric to measure as it can tell you a lot about efficiency. Cycle time describes how much time the team needs to complete a specific task, so this metric will tell the team how fast it brings value to the end user.
The goal is to have cycle time be as low as possible—meaning the team is fast to bring value. The shorter the cycle time, the higher the revenue and the more efficient the organization will be.
3Number of story points
Story points are used to indicate how hard it is to complete a task or project. An engineering team will typically assign a numerical value to each story; the higher the value, the more effort the team expects to spend on that particular story.
It’s a good idea for teams to assign story points to each issue so they can measure the total number of story points that are completed per sprint.
4Mean time to restore
Mean time to restore (or recovery) measures how quickly a team recovers from failure. A failure can look like an interruption to the expected production, the introduction of a new bug, or a hosting infrastructure going down.
Whatever the failure may be, mean time to restore hints at how quickly the team can understand and resolve problems as a cohesive unit to get back on track. When a team has a low mean time, this metric indicates that should a problem occur, the team can quickly restore productivity to a functional state.
To calculate mean time to restore, track the average time between a failure being reported and the issue getting fixed.
5Days worked
Like the name of this metric suggests, the days worked metric measures how many days a team has been active during a sprint or iteration. Tracking this metric allows managers to keep their team happy and avoid the likelihood of burnout. Each team may want to put a cap or a limit on the days worked to avoid burnout—and the stress that comes with it—at all costs.
6Context switching
Another critical engineering metric to measure is context switching. This metric signifies how often an engineer team member has to move from one issue to another due to roadblocks or unforeseen challenges.
When context switching happens often, it hints that the team is inefficient and improvements should be made. Management may meet to discuss changes that need to take place to ensure the team can focus and work as productive as possible.
7Deploy frequency
Next, we have deploy frequency, which allows you to measure how often the team releases code to production. Usually, a development team aims to release smaller batches of code as often as possible; when they do so, deployments are easier to manage, and the overall quality of the code increases.
8Change failure rate
A change failure rate can measure how often an engineering team releases or debuts a change to production that causes a failure to take place. These are often changes that lead to a bug or code that needs to be rolled back because it didn’t meet a customer’s or client’s expectations.
This metric will show engineering leads more information regarding the quality of the software a team builds. Taking the time and energy to fix bugs or rewrite code can be costly and doesn’t add value for customers. A high change failure often suggests lower-quality software, leading to frustrated customers and a potential loss in revenue. It’s best to aim for a change failure rate between 0 – 15%.
9Rework ratio
Another important engineering metric to track and measure is the rework ratio. This ratio indicates the amount of code that needs to be rewritten once it has been delivered to the end user. When the rework ratio is high, it means that there have been a number of problems along the way (like a lack of communication amongst the team), or that the review process needs to be reworked.
10WIP balance
Last but certainly not least is the WIP (work in process) balance metric. The WIP balance makes it possible to know if work is being distributed evenly across every member of the team. It can also provide an overview of how much work each engineer has on their plate at any given time.
Knowing the WIP balance can ensure work is distributed evenly and that no one feels overwhelmed or overloaded by their tasks.
How to track engineering metrics with Fellow
It’s one thing to track engineering metrics in a document that isn’t organized and that people eventually forget about, and it’s another to track these metrics with a tool like Fellow—the latter option is so much easier!
Think of engineering metrics as objectives and key results (OKRs) that you can track as part of your regular meeting workflow. This way, it’s easy to stay on top of your team’s metrics by clearly recording, defining, and tracking the progress of these metrics in Fellow’s Objectives tool. These numbers will be at your fingertips for a quick review during team meetings, sprints, and one-on-ones. Having this information handy also creates transparency since other members of the organization and key stakeholders can check how the team is tracking specific metrics and making improvements where necessary.
Having these metrics easily accessible can cut down on confusion related to which team member is responsible for which task, shorten downtime when challenges arise, and ensure clear communication across the board.
The numbers don’t lie!
When it comes to the performance of your engineering team, remember that these metrics need to be tracked consistently to get the big picture. After a couple of weeks, consider the insights you’ve gathered and determine if some tweaks or changes should be made for better productivity and efficiency.
Even if the metrics you’re collecting don’t show success like you’ve hoped, don’t stop measuring them! Start small and make the necessary changes, and you’ll likely be surprised by how quickly things can improve.
-
 Engineering
DORA Metrics: Measuring Software Delivery Performance
7 minute read -
Engineering
Technical Debt: What It Is and 7 Ways to Avoid It
7 minute read -
Leadership
22 Business Success Metrics Every Leader Should Track
9 minute read -
Engineering
Measuring & Increasing Software Engineering Productivity
7 minute read -
Engineering
How to Measure and Develop Engineering Productivity
8 minute read -
Engineering
10 Software Engineering Velocity Best Practices
7 minute read -
Management
How to Measure Employee Productivity: Do’s and Don’ts for Managers
7 minute read -
Engineering
Complete Guide to Empowering Engineering Teams
7 minute read -
Engineering
8 Ways to Build Platform Engineering Teams
7 minute read


-
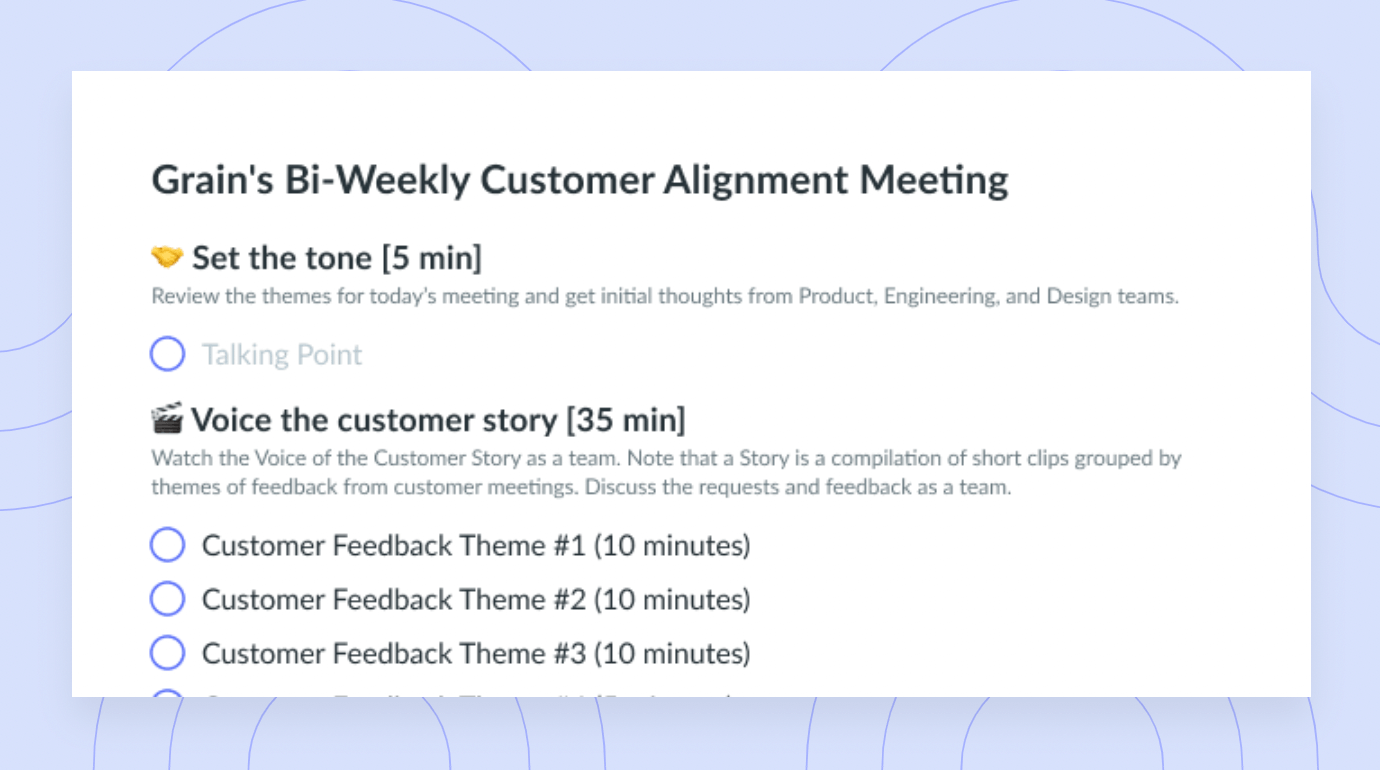
Grain’s Bi-Weekly Customer Alignment Meeting Agenda Template
-
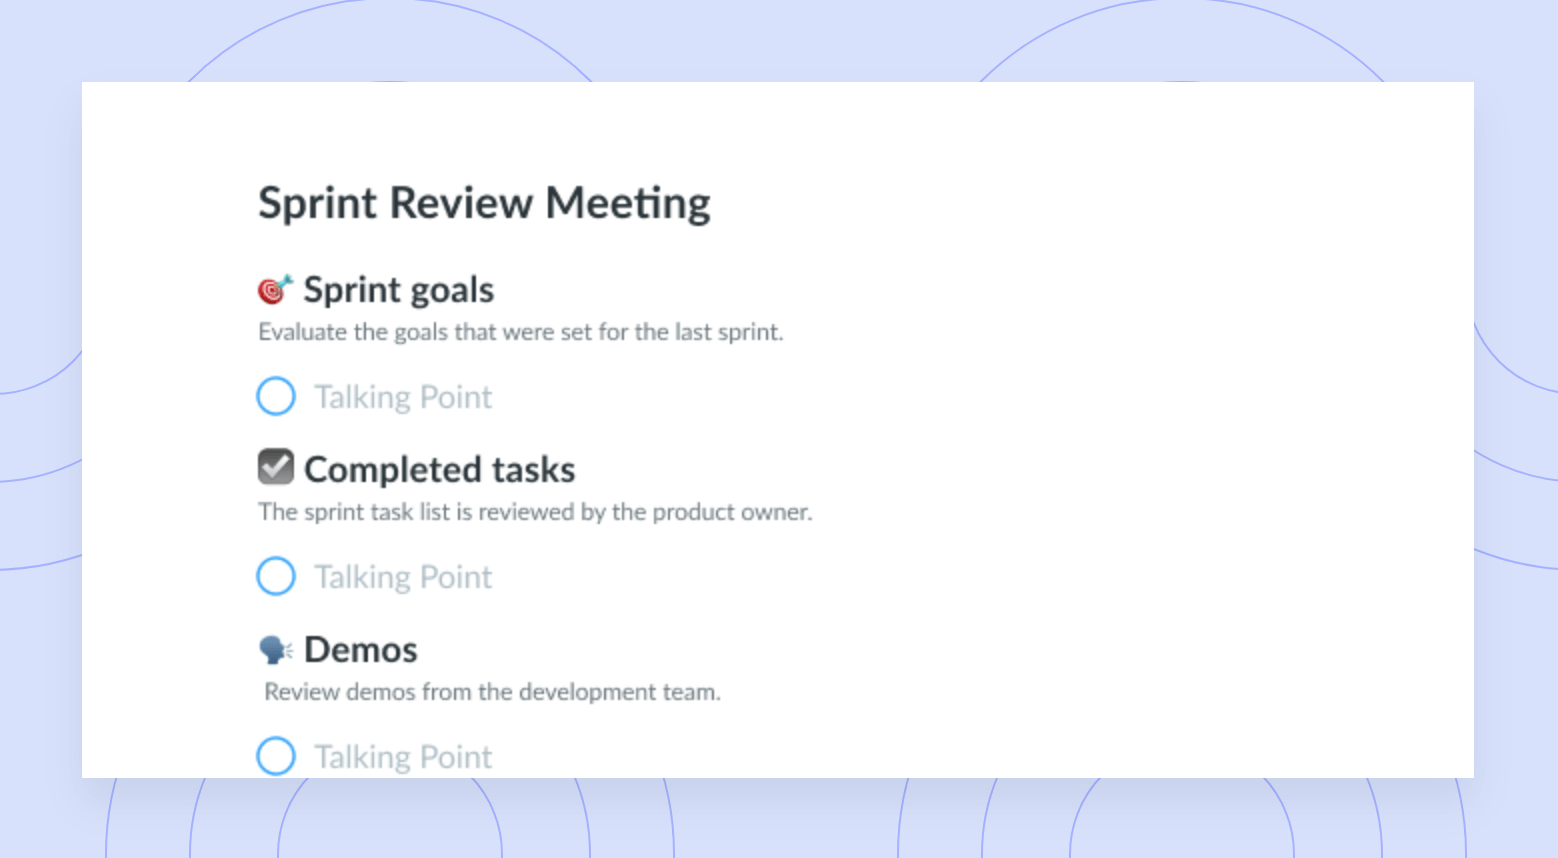
Sprint Review Meeting Agenda Template
-
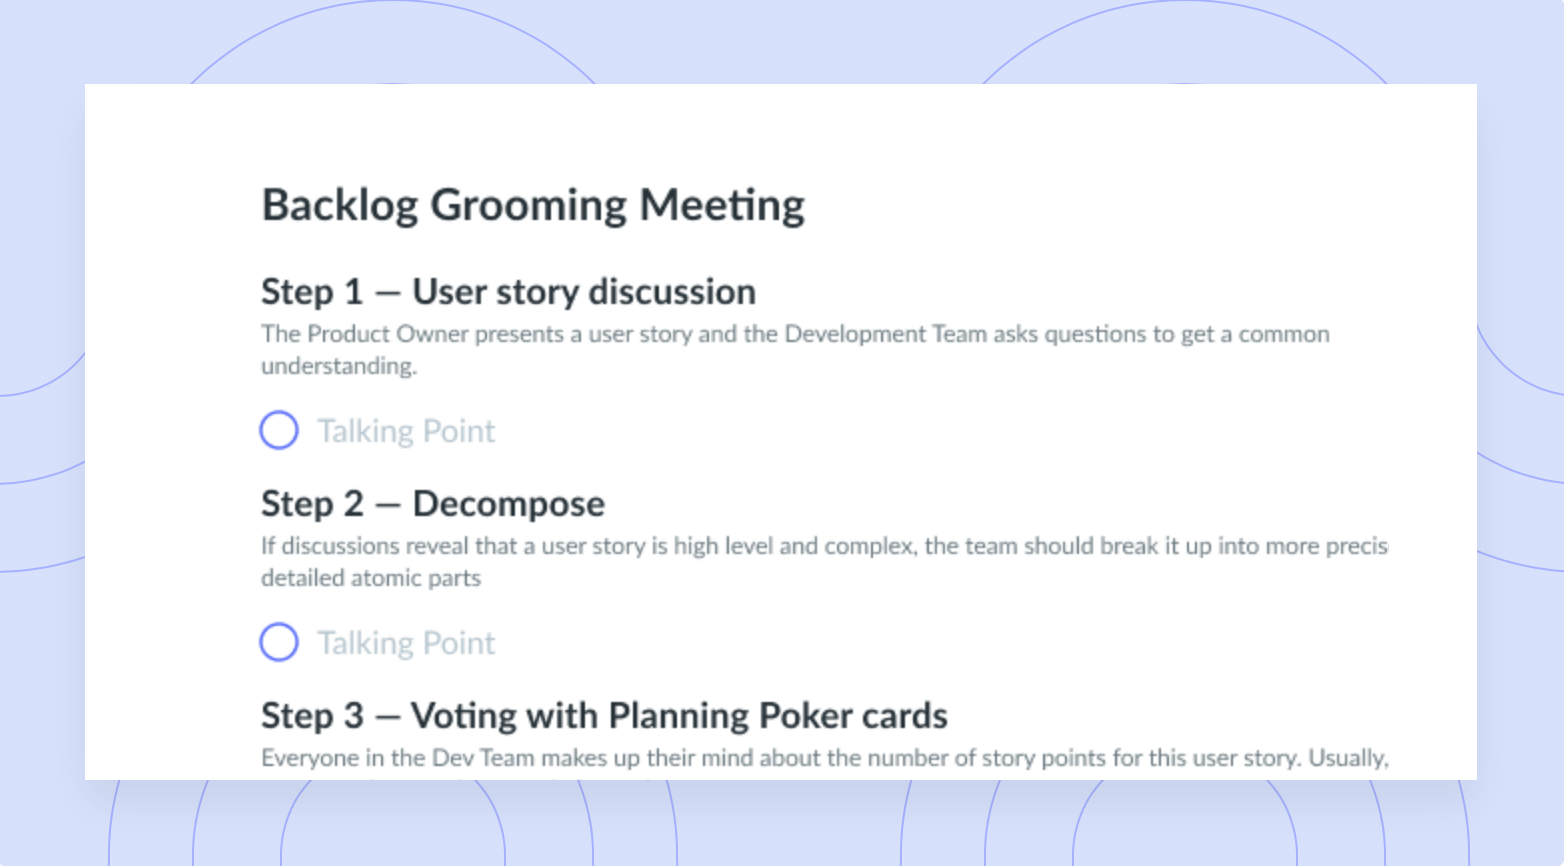
Backlog Grooming Meeting Template
-
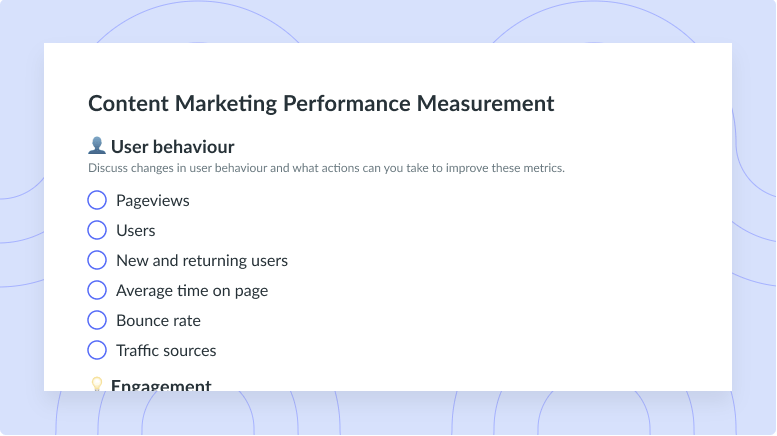
Content Marketing Performance Measurement Meeting Template
-
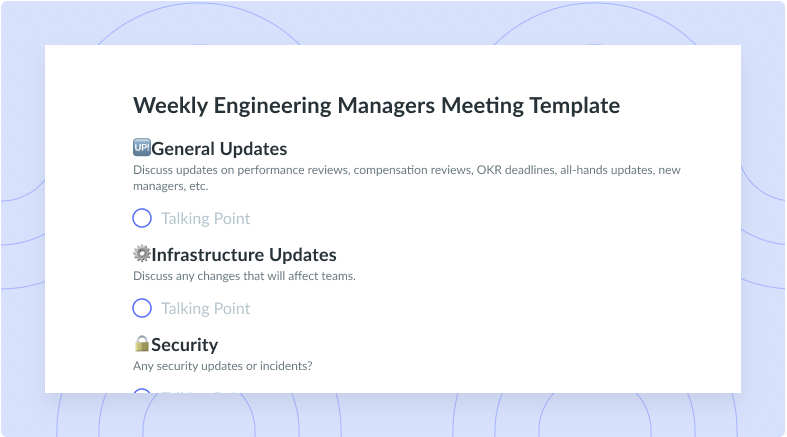
Weekly Engineering Managers Meeting Template
-
SEO Team Meeting Template
-
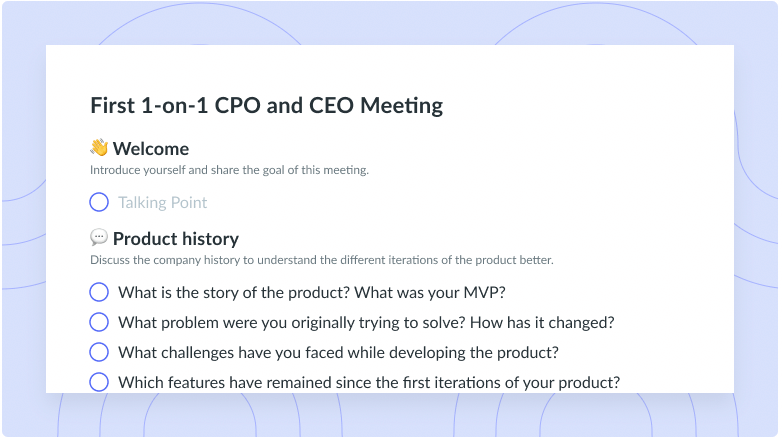
First 1-on-1 CPO and CEO Meeting Template
-
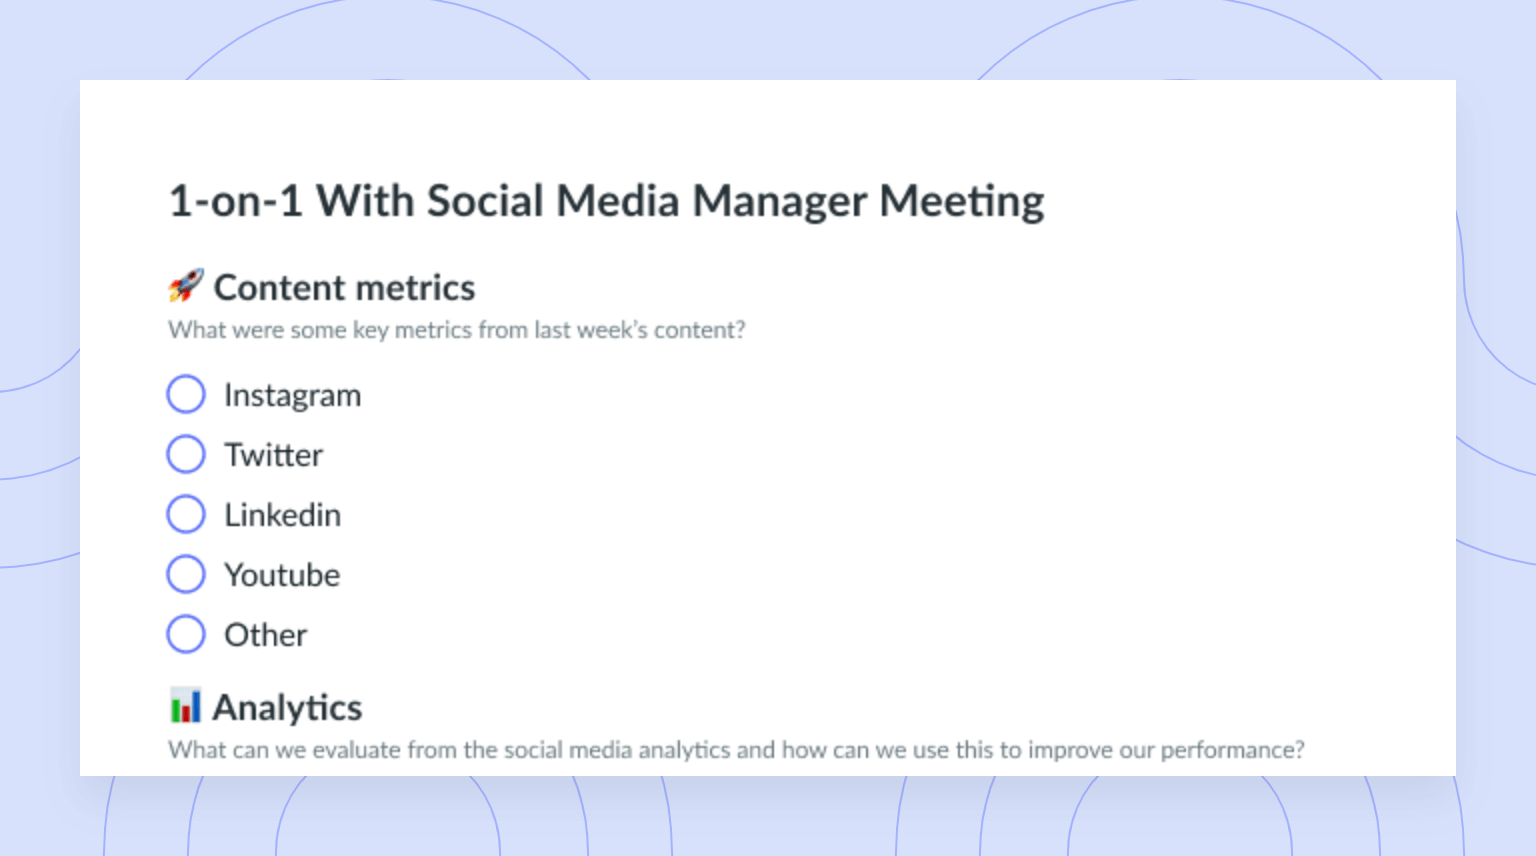
1-on-1 With Social Media Manager Meeting Template
-
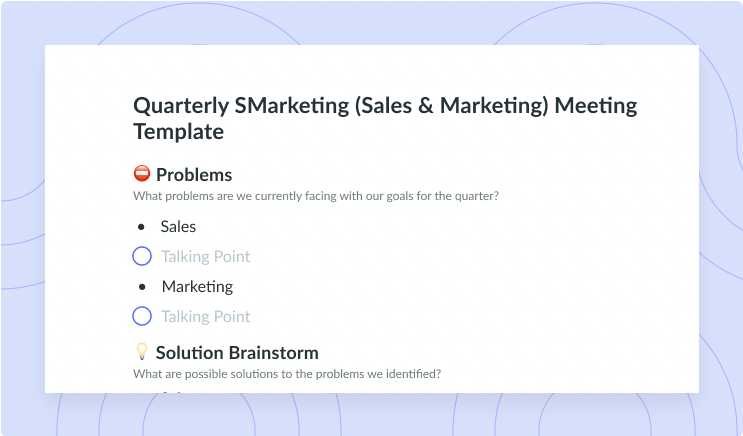
Quarterly SMarketing (Sales & Marketing) Meeting Template